Melina Estela Dalmau: Decoding sunsets
Who doesn’t like sunsets? Pausing everything just to be there, with some clouds drifting, birds flying, and thoughts flowing. That moment you decide to take for yourself, to merely contemplate the sky. Realizing that the earth is moving, and as a consequence the sun approaches the horizon. And how this translates into a full-color experience: from clear blue to yellow, orange, even pink. All the colors coexisting smoothly, changing together.

But what if I told you that this sunset could be turned into a grid of numbers? Yeah… Then it will lose the magic of the present, but we can play with numbers!
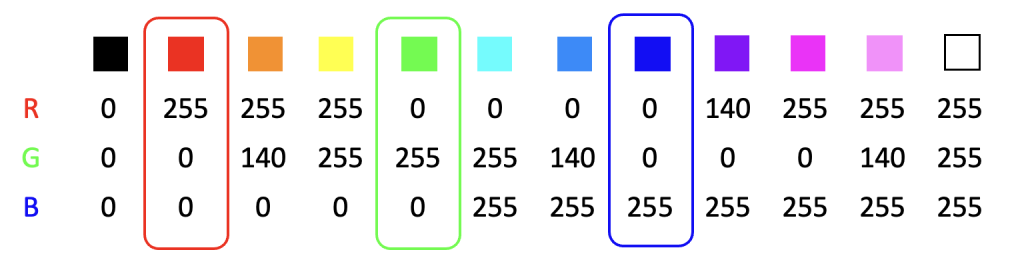
Any digital image is made up of tiny dots of colors, called pixels (picture elements). That is, every pixel is one specific color, and by combining several pixels in a grid, we get a picture. On the other hand, colors in digital screens are expressed by the combination of red, green and blue in different proportions, which is known as RGB color model. The amount of each color is commonly an integer ranging from 0 to 255, with 0 representing the absence of that color (least saturated) and 255 representing the full presence of it (most saturated).
For instance, black is the absence of all colors, with 0 in red, green and blue. Yellow is made by combining red and green (255 each) but nothing of blue (0). And in the case of orange, it also results from combining red and green, but with green being less present (140 in the example below). Therefore, this model is called additive, as the main colors are superimposed to create the others.
In this way, the RGB color model allows us to represent 16 777 216 different colors! I won’t discuss if this amount is enough or not, because the idea of color is not more than a perception created by our visual system, and this model is just a way of representing colors in digital displays.
Now, having this color model in mind, our sunset can be decomposed into three separate images, each one representing the amount of red, green and blue.
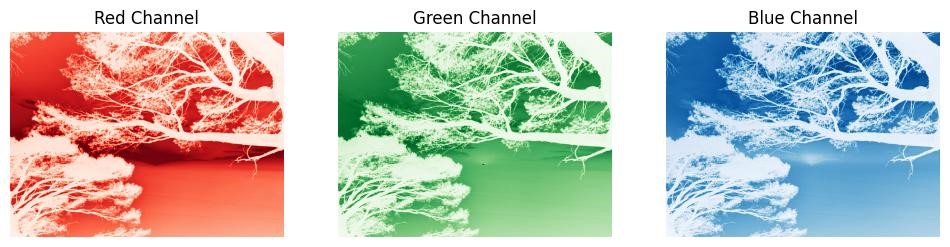
But these amounts indeed are numbers. So, what we really have is three grids of numbers! Which in mathematics are called matrices.
And this is where the game begins. For instance, when editing an image to be warmer, what we are really doing is increasing the intensity of the red and green channels while decreasing the intensity of blue. Conversely, for a colder image, we can intensify the blue or decrease the intensity of red. Making an image brighter involves increasing the intensity of all three channels equally.
These are basic ideas of what is happening when we edit photos, i.e., playing indirectly with numbers. Of course, there are plenty of image editors that make it easier to edit photos than going to this matrix-level. However, when it comes to science, that’s where we go: to play with matrices.
Quantifying the brain
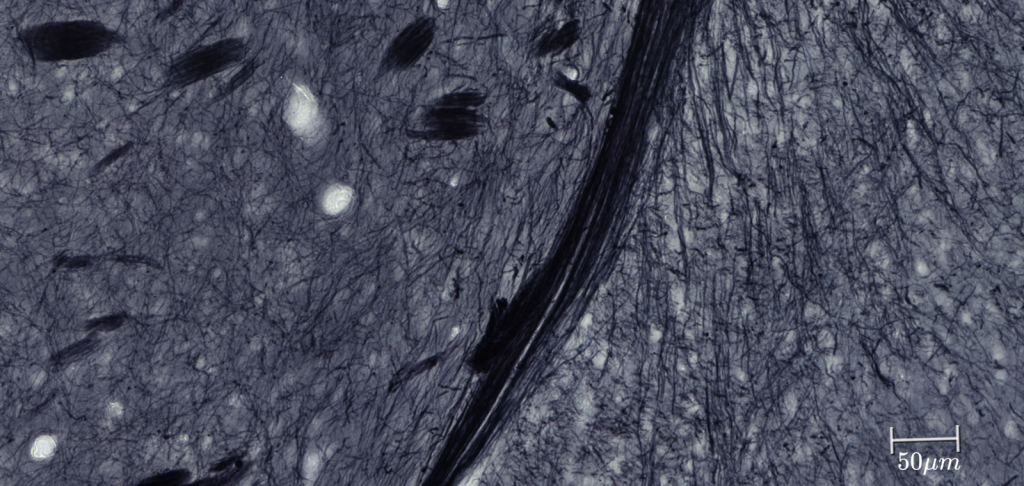
And how does this relate to my research? I’m currently working with photomicrographs of rat brain sections (see below). The tissue has been stained to enhance myelin content. Myelin insulates the axons of neurons, allowing us to study axonal arrangement. And to extract features from these images, my tool of choice are matrices!
Note that matrices are not just related to images; they are like number-containers, and for instance, they can represent interactions of different brain regions, physical properties of materials, or gene expression profiles. In fact, matrices are fundamental elements in machine learning and quantum mechanics.
To sum up, the quantification of the real world is needed for its own study. By transforming complex phenomena into structured representations, we can analyze, compare and model, and with that, gain understanding of what surrounds us and discover hidden patterns and relationships. However, even though all of this is amazing, I wouldn’t trade a beautiful sunset for numbers.
Melina Estela Dalmau works as a doctoral researcher in the Neuro-Innovation PhD programme. Her research seeks to bridge the gap between imaging and brain tissue.