Faezeh Heidari: Mapping Hidden Brain Patterns in Focal Structural Drug Resistant Epilepsy: Imaging and Surface-Based Morphometry
In my previous blog, we explored the fundamentals of epilepsy and its clinical challenges. Now, let’s dive deeper into the imaging and computational approaches that are transforming how we understand and treat focal drug-resistant epilepsy (DRE).
Epilepsy surgery has traditionally focused on removing the visible lesion or the epileptogenic zone (EZ) which is the brain region where seizures originate. But what happens when the lesion is subtle or invisible on MRI? And why do some patients continue to experience seizures even after surgery? The answer lies in hidden structural patterns beyond the lesion, which advanced imaging and computational morphometry can reveal.
Imaging Beyond the Lesion
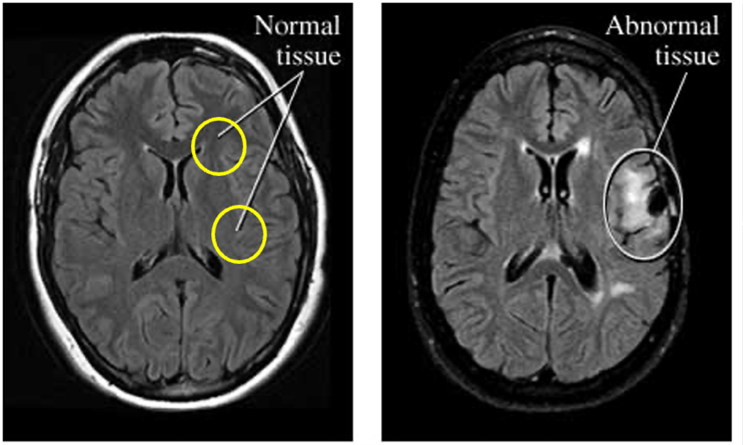
Conventional MRI distinguishes MRI-positive epilepsy (visible abnormalities like focal cortical dysplasia (FCD)) from MRI-negative epilepsy, where scans appear normal despite persistent seizures. This diagnostic gap underscores the need for quantitative imaging to detect subtle cortical changes invisible to standard radiology.
Focal Cortical Dysplasia: Histology and MRI Features
FCD is the most common cause of focal structural drug-resistant epilepsy. The lesions are subtle and visible in MRI. It is a developmental malformation of the cortex that disrupts normal brain architecture and function, leading to seizures that often resist medication.
Histological Perspective:
Normal cortex is organized into six layers (L1–L6), with neurons arranged in a structured pattern.
FCD has three main subtypes depending on how cortical lamination process disrupts during FCD. As seen in Figure 2:
- FCD Type I:
- FCDIa: Occipital lobe shows abundant neuronal microcolumns, small neurons aligned vertically like “strings of pearls.”
- FCDIb: Temporal lobe lacks normal lamination and has a dramatically thinned cortical diameter.
- FCD Type II:
- FCD IIa: Complete loss of cortical layering, large dysmorphic neurons scattered randomly across the cortical ribbon.
- FCD IIb: same as FCS IIa with Balloon cells (hallmark of IIb) often visible in immunohistochemistry.
- FCD Type III: Associated with other pathologies like hippocampal sclerosis, vascular malformations, or perinatal injury.
From clinical insight, these histological abnormalities explain why FCD disrupts normal cortical function and leads to epilepsy.
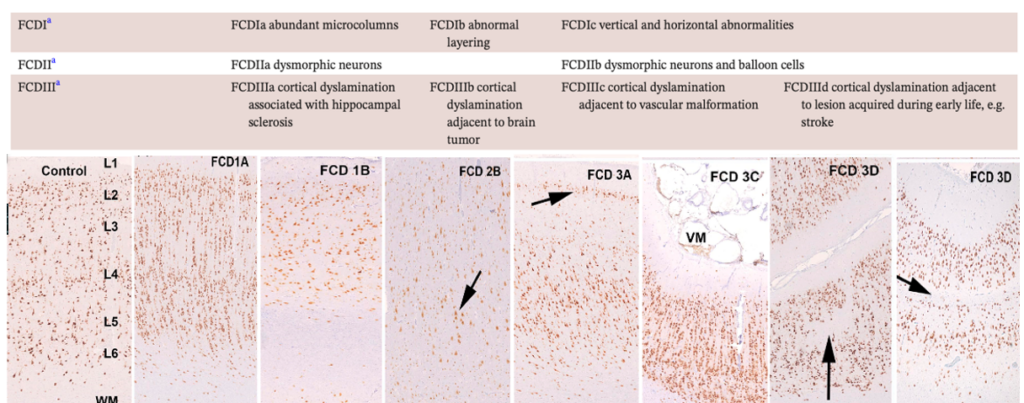
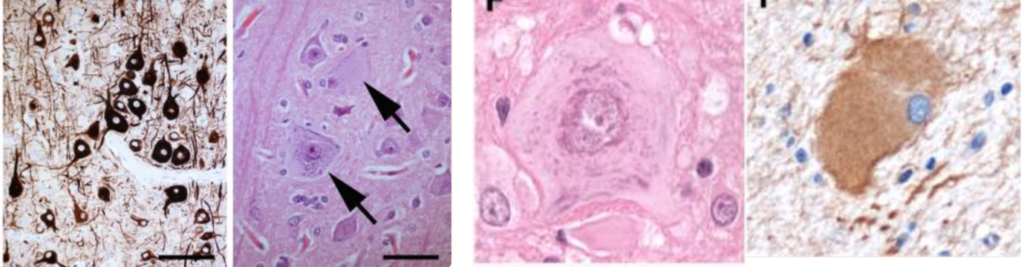
Figure 3 in turn zooms in on microscopic features of FCD II subtypes:
- FCD IIa: Dysmorphic neurons with abnormal neurofilament protein accumulation (SMI32).
- FCD IIb: Enlarged dysmorphic neurons with huge nuclei and abnormal Nissl aggregates; Balloon cells expressing vimentin, another hallmark of IIb.
MRI Perspective:
MRI features of FCD II are subtle but critical for diagnosis as Figure 4 demonstrates.
- Transmantle Sign: Funnel-shaped hyperintensity extending from the lateral ventricle to the cortex, most characteristic of FCD IIb.
- Other MRI markers:
- Abnormal cortical thickness
- Blurring of gray-white matter junction
- Signal abnormalities on T1 and T2 sequences
Subtype Examples:
- FCD IIa: Thickened cortex and hyperintensity on T2-weighted FLAIR but lacks balloon cells histologically.
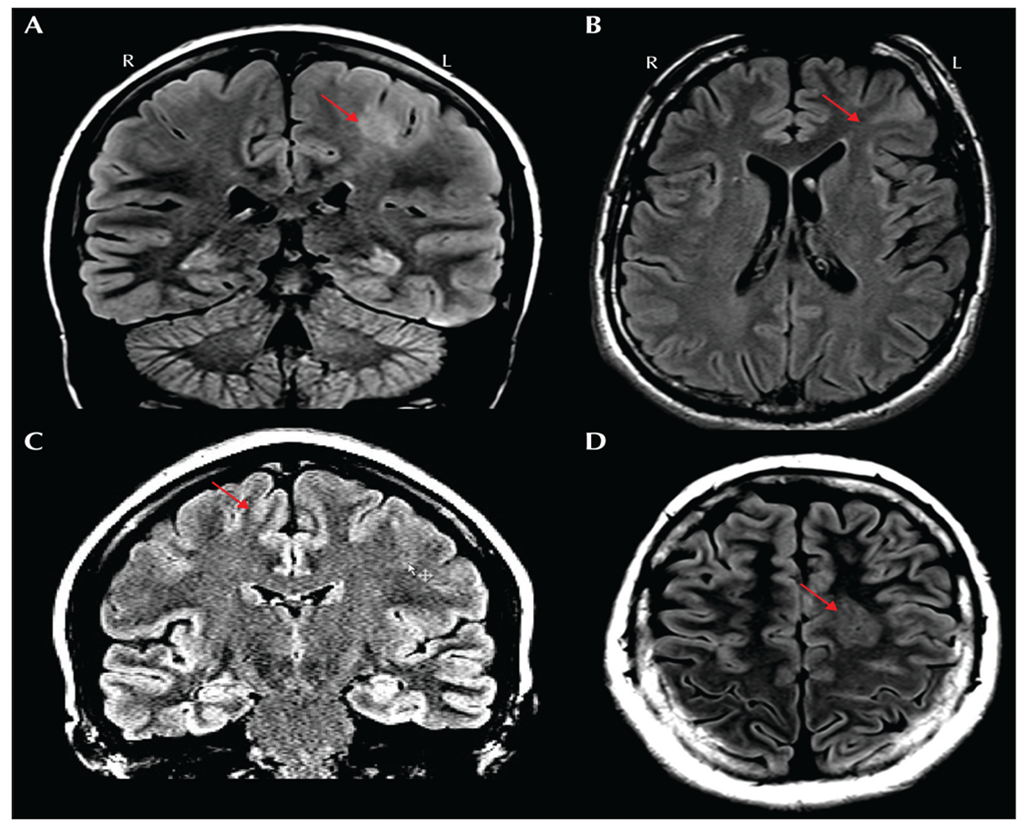
- FCD IIb: Strong transmantle sign and severe cortical thickening.
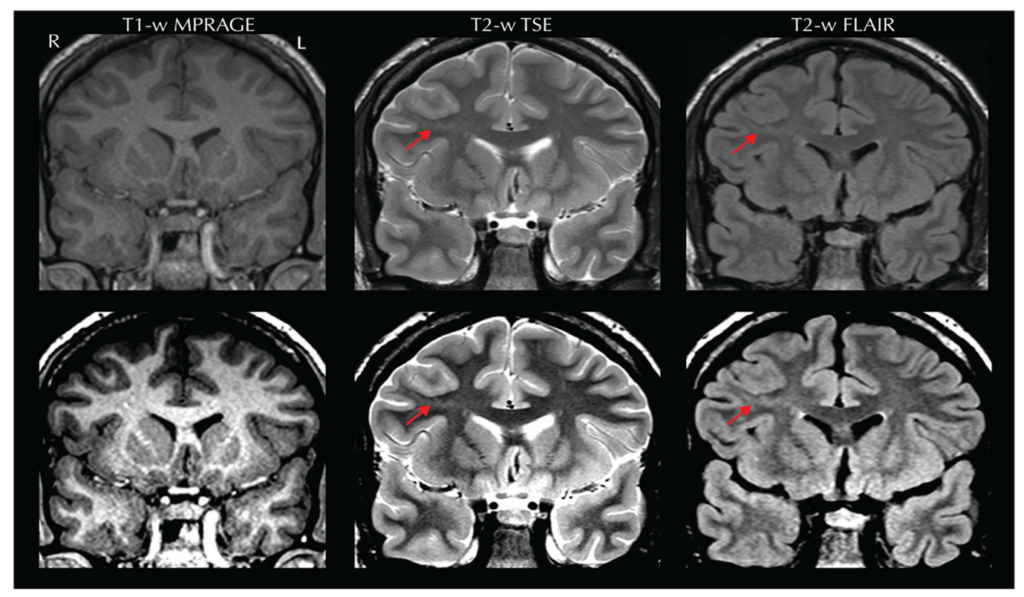
Figure 5. Source: https://pubmed.ncbi.nlm.nih.gov/32763869/.
The challenge is that subtle lesions, especially in sulcal depths, often escape detection on standard MRI, requiring advanced post-processing techniques like SBM (Surface-Based Morphometry).
Why is MRI important? Since in the presence of an MRI lesion, the likelihood to become seizure free after surgery increases of about 2.4 times.
Why Go Beyond the Lesion?
Even expert lesion detection and surgical resection do not guarantee seizure freedom. Up to 30–50% of patients continue to experience seizures post-surgery. Why? Because epilepsy is not just a focal problem. Epilepsy is increasingly recognized as a network disease, where structural and functional disruptions extend beyond the focal lesion. Ignoring these hidden abnormalities risks incomplete treatment and seizure relapse. FCD-related epilepsy disrupts this structural network. These changes manifest as structural alteration means differences in cortical thickness, volume, and curvature between hemispheres. Quantifying these morphometric features can:
- Reveal network-level disruptions
- Explain large-scale neuroanatomical impairments
- Improve surgical planning
Surface-Based Morphometry
After understanding the histological and MRI features of FCD, the next step is to quantify structural changes using computational morphometry.
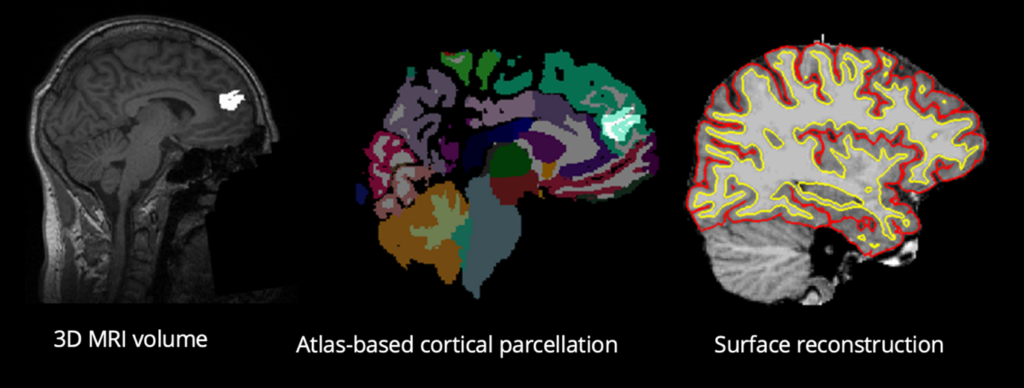
To capture these subtle patterns, we use neuroimaging tools that reconstructs cortical surfaces and computes morphometric features with different steps. This approach transforms raw MRI data into a vertex-based representation, enabling precise measurement of cortical features.
Why do this?
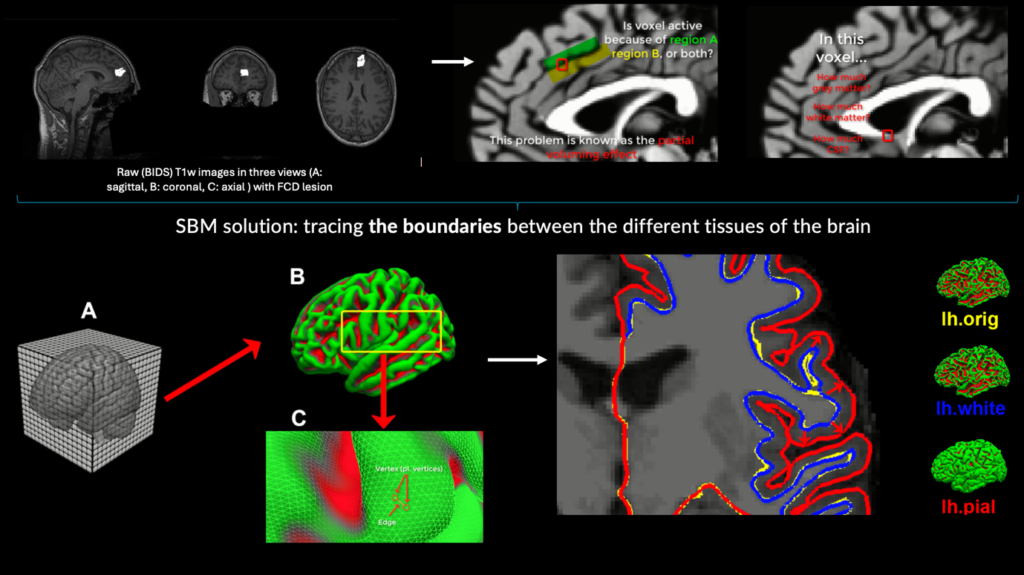
Traditional voxel-based analysis uses 3D cubes (voxels) to represent brain tissue. However, the cortex is a folded sheet, and analyzing it as a surface allows for more accurate measurement of cortical thickness, curvature, and surface area.
How it works:
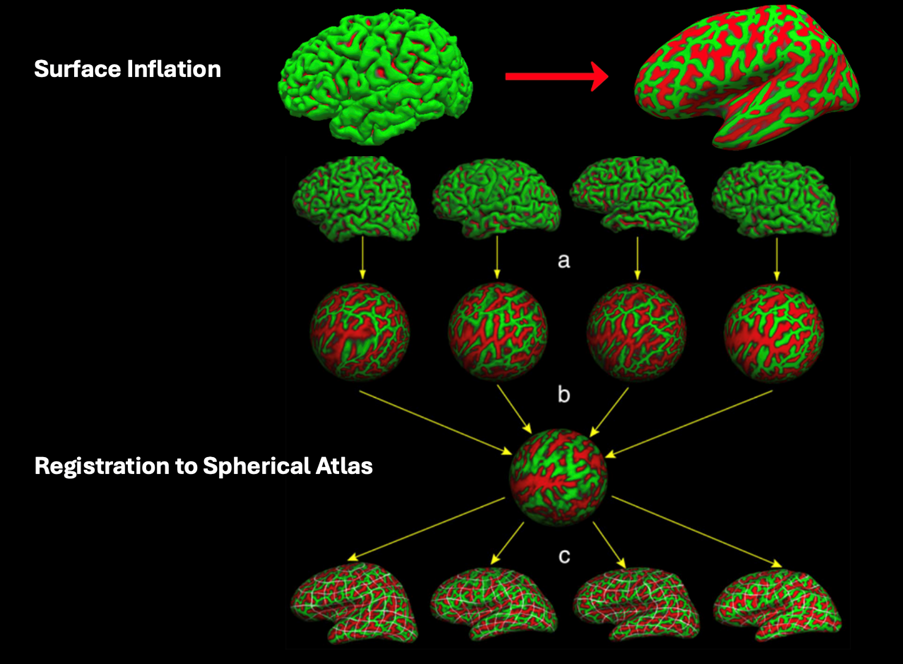
Using Neuroimaging pipelines, brain volume can be inflated on the cortical surface like a balloon, smoothing out folds to create a spherical representation. This enables precise mapping of anatomical features across individuals. Figure 8 visualises these.
- Imagine the brain as a wrinkled balloon (gyri and sulci). It is inflated it to a smooth sphere for analysis.
- Instead of voxels, the surface is represented by vertices and edges, like a mesh.
- At each vertex, structural metrics (thickness, curvature, etc.) is calculated.
Why is this important?
This approach improves accuracy in detecting subtle cortical changes, especially in conditions like FCD where abnormalities may be localized to sulcal depths and understanding these hidden structural patterns can improve presurgical planning.
Faezeh Heidari works as a doctoral researcher in the Neuro-Innovation PhD Programme. Her research focuses on enhancing the identification of the epileptogenic zone.