SpecTex – HyperSpectral Texture Image Database
SpecTex is a spectral image database including sixty textile samples with different texture patterns. The image dataset is intended for spectral texture analysis applications. The data is collected from four-hundred to seven-hundred-eighty nanometers in wavelengths with five nanometer intervals. The pixels are flat-fielded to present the reflectance spectrum at each point.
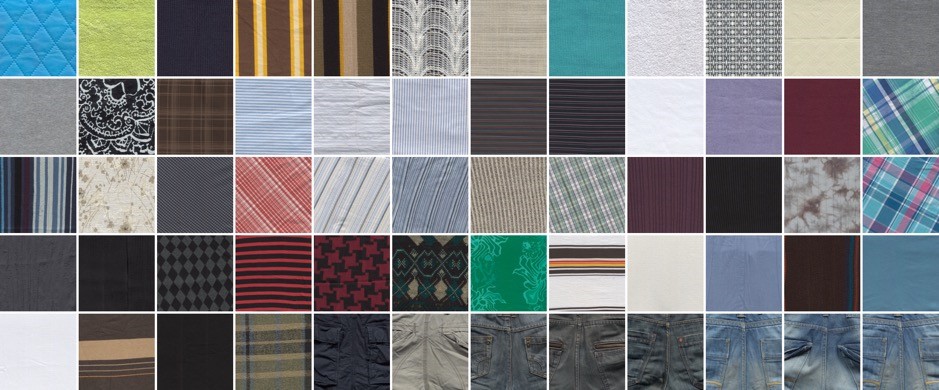
The spectral images are three-dimensional matrices with two spatial and a third spectral dimensions. Therefore, they are also referred as image cube. Each pixel in the image cube represents a reflectance spectrum. There are sixty samples in the SpecTex database T01 to T60. Fig. 1 shows the simulated RGB image of the samples, ordered from top-left to bottom-right. All samples are measured from fabric material, except T10 and T14, which are plastic. The size of image cubes is 640 x 640 x 39, where the spectral data is collected in visible wavelengths 400 nm to 780 nm with 5 nm intervals. The intended application of the database includes but not limited to spectral image processing and texture analysis. The database is hereby publicly accessible.
Technical details
SpecTex images were captured with a line-scanning spectral camera ImSpector V8 (Specim Spectral Imaging Ltd. Finland), using a GretagMacbeth SpectraLight III unit (X-Rite Inc. USA) as the light source, with a D65 standard illuminant simulator. A Navitar Zoom 7000 objective lens (Navitar Inc. USA) with manual focus collected the light. The line-scanning camera captures the spectral data one line at a time, and the image cube is formed by stacking the lines. A moving table with a stepper motor unit performed the push-broom scanning. The light source lit the sample from above with 45 degrees angle and the camera pointed perpendicularly to the sample. Fig. 2 shows the imaging setup.

Samples were collected in two batches. The first batch (T01 to T23) is captured in two columns, 6.4 cm×12.8 cm each, that is a total square area of 164 cm2. The second batch (T24 to T60) is captured in three columns, 7 cm × 21 cm each, covering a total square area of 441 cm2 textile. The CCD sensor with 1024 × 1280 pixels records the spectral data on its first dimension and the spatial data on the second. With a 4 × 4 and 6 × 6 binning for the first and the second batches respectively, and selecting the proper moving steps for the motor to have a square pixel, a final 640 × 640 spatial size is achieved for both batches. Therefore, the spatial sampling resolution of the two batches are 6402/164 cm2=25 (sample/mm2 ) and 6402 /441cm2=9 (sample/mm2), respectively.The camera’s spectral sensitivity is from 380 nm to 800 nm which is recorded on 1024 pixels. That is roughly 2.4 nm spectral resolution. However, the actual spectral resolving power is only about 5 nm. We further crop the measurements outside the range 400 nm to 780 nm and decimate to 10 nm intervals. Thus, the spectral size of the image cube is 39.
To avoid saturation in all cases, the camera’s exposure time is set to 450 ms, so that in measuring the white reference, the sensor is exposed to 80 % of its dynamic range in the brightest image band. All the measurements are flat-fielded with the white reference and the dark-frame readings, so that each pixel of the image cube specified the reflectance spectrum. For further information on the data collection settings and the sample selection process please refer to article [1].
TIFF-stack data architecture
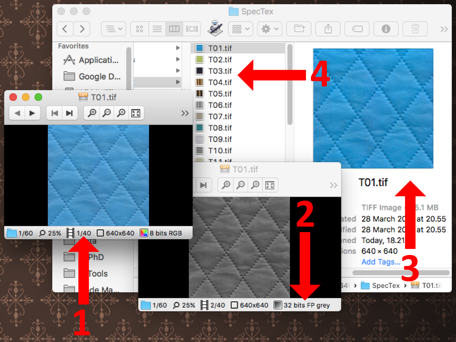
Using the provided flexibility in the TIFF specifications, we have proposed a novel data architecture for managing the spectral images based on multi-image TIFF. TIFF allows saving a stack of images in a single file, within separate Image File Directories (IFDs). The proposed architecture uses the first IFD to save a simulated RGB presentation of the image cube, and saves each band as a separate grayscale image in the following IFDs. Fig. 3 shows the advantages of this architecture. Each spectral image is saved in a single file, without separate header file. The files are recognized by any conventional image viewers and can be viewed without requiring special application. In Fig. 3.1 the image viewer is Xee and it is showing the simulated RGB image of T01. The info bar at the bottom of the application window is showing that the file contains 40 images, the first of which is an 8-bit RGB. The second image, which is the first band of the spectral cube is shown in Fig. 3.2 as a 32-bit floating-point grayscale image. Moreover, the file manager of the operating system recognizes the images and provides preview and thumbnail views for the images as in Fig. 3.3 and Fig. 3.4 which shows the “Finder” file manager in Mac OS X.
Representative spectral signatures of SpecTex database
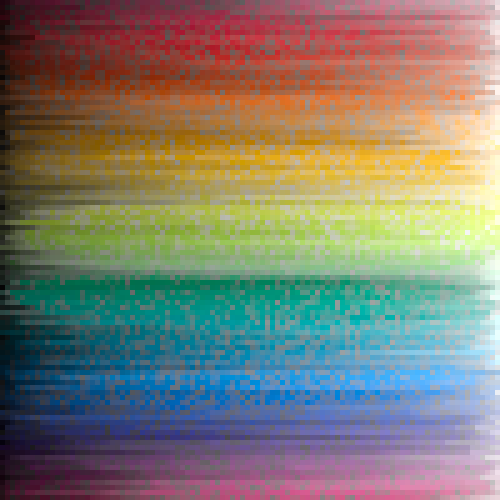
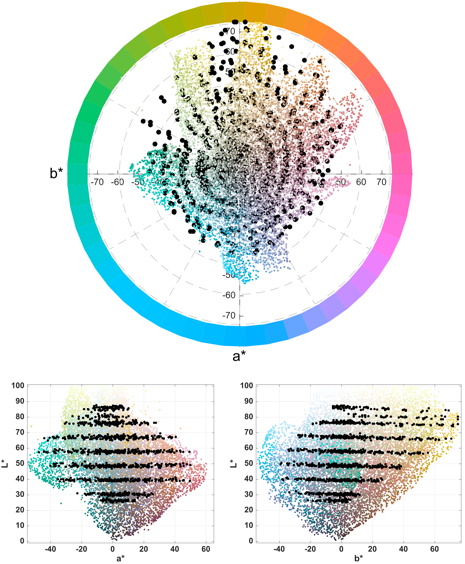
We also provide two subsets of representative reflectance spectral that exist in the SpecTex dataset. The representatives are selected by calculating the CIEL*a*b* values of the spectra and sampling the data with a random grid with uniform distribution in the CIEL*a*b* space. This process is repeated for each SpecTex sample separately, leading to the first set of spectral signatures with 178.684 members. And another time on these members, to find a second set of 10.000 endmembers. Fig. 4 shows the gamut of the second set. For comparison, the gamut of Munsell book of color is plotted with black dots. The SpecTex gamut is rich in both light and dark colors. Also, saturated colors in some hue angles exist. Fig. 5 shows the palette of colors of this set. The representative spectra are available for download as a separate Matlab data file.
Database contents and download links
The materials of SpecTex dataset can be downloaded from here.
The file contents are as follows:
-
SpecTex_cubes_05nm.zip (3.3 GB)SpecTex spectral image cubes in TIFF format (60 images, 5 nm intervals)
-
SpecTex_cubes_10nm.zip (1.7 GB)SpecTex spectral image cubes in TIFF format (60 images, 10 nm intervals)
-
SpecTex_spectral.zip (15.1 MB)Representative spectral signatures of SpecTex database
-
m_files.zip (45.5 kB)The utility Matlab functions
The Matlab functions are:
- t_tif.read.m loading the TIFF files into Matlab environment
- t_tif_write.m saving the image cubes with the proposed TIFF-stack architecture
- t_spd2sth.m converting spectral data to any tristimulus values under any light source
- t_mom_ftr.m calculating the Moment Features of the spectral images as presented in [1]
- example_spectex.m an example code for showing the usage syntax of all the functions
Citing
For citing the database or the utility functions:
[1] A. Mirhashemi, Introducing spectral moment features in analyzing the SpecTex hyperspectral texture database, Machine Vision and Applications (2017).
License
The SpecTex dataset is licensed under a Creative Commons Attribution-NonCommercial-ShareAlike 4.0 International License. It is free to publish research containing results derived from this database as long as the database is cited properly.
Contacts
For further questions or any issues regarding the SpecTex dataset, please contact the Computational Spectral Imaging Research Group, Professor Markku Hauta-Kasari, by email markku.hauta-kasari (at) uef.fi