Spectral Image Database of Nordic Sawn Timbers
Introduction
In this website we provide information on comprehensive spectral image database of Nordic sawn timbers for free public use. The full size of data is around 500 GiB so the distribution is handled with physical hard drive distribution. Online distribution is under consideration. For data access and further information, please contact Prof. Markku Hauta-Kasari at any time with email markku.hauta-kasari (at) uef.fi
Economically significant Finnish wood species Birch (Betula sp.), Norway spruce (Picea abies) and Scots pine (Pinus sylvestris) were chosen to be included in this database. The total amount of spectral images was 107 which contained heartwood, sapwood, decayed wood, blue stain, mold, resin, early wood, late wood, knots, cracks, pith, reaction wood and bark. Board and crosscut samples were measured in frozen, melted and air dried conditions. Each pixel in the spectral image contains reflectance from 300-2500 nm wavelength range with 5 nm sampling. Also, the photoluminescence of samples excited by ultraviolet B (UV-B) light source was measured. Used spot size was 250 µm with 80 mm * 200 mm imaging area producing 44 millions spectra in all.
The associated journal article for the data is Spectral image database of Nordic sawn timbers where data acquisition process is described in detail. In manuscript we also introduce and provide examples of possibilities of this spectral image database as the detection of the spatial distribution of aromatic lignin and the moisture content of melted timber. This is only the tip of the of the full knowledge potential that the database has.
The primary citations for this database
For the database:
Hirvonen T, Orava J, Penttinen N, Luostarinen K, Hauta-Kasari M, Sorjonen M, Peiponen K-E. Spectral image database for observing quality of Nordic sawn timers. Wood Science and Technology. 2014;48(5);995-1003. Article on publisher webpage.
For the used equipment:
Hirvonen T, Penttinen N, Hauta-Kasari M, Sorjonen M, Peiponen K-E. A Wide Spectral Range Reflectance and Luminescence Imaging System. Sensors. 2013;13(11);14500-14510. Article on publisher webpage.
Database content description
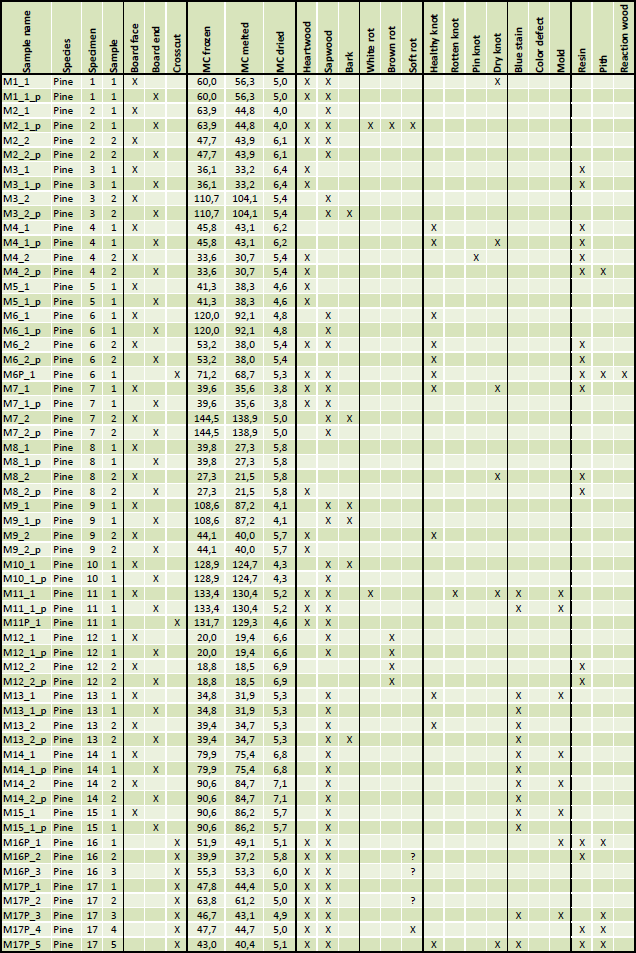
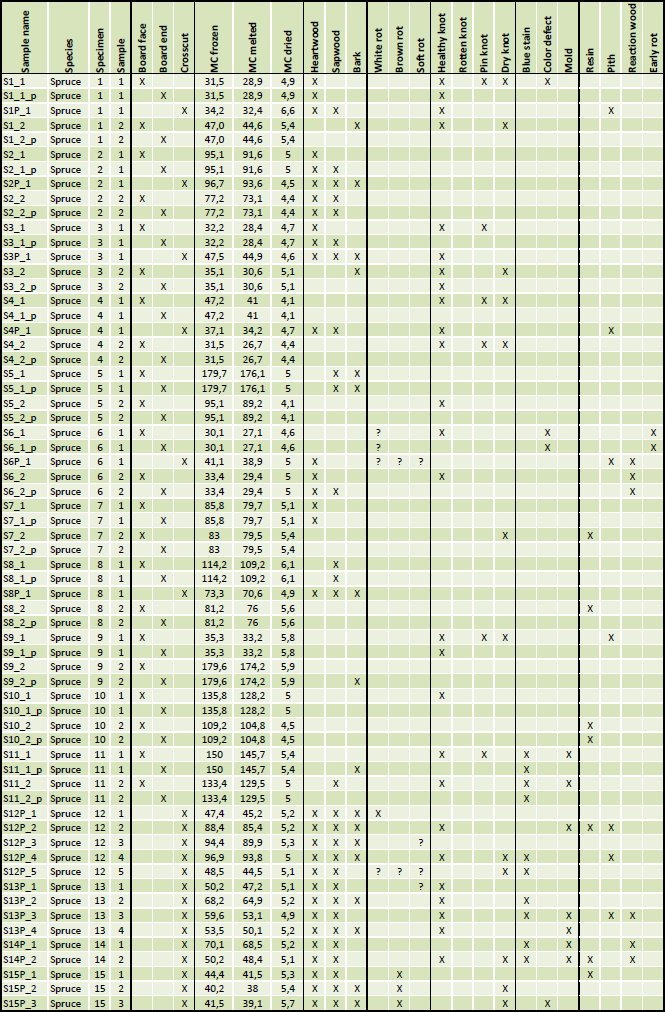
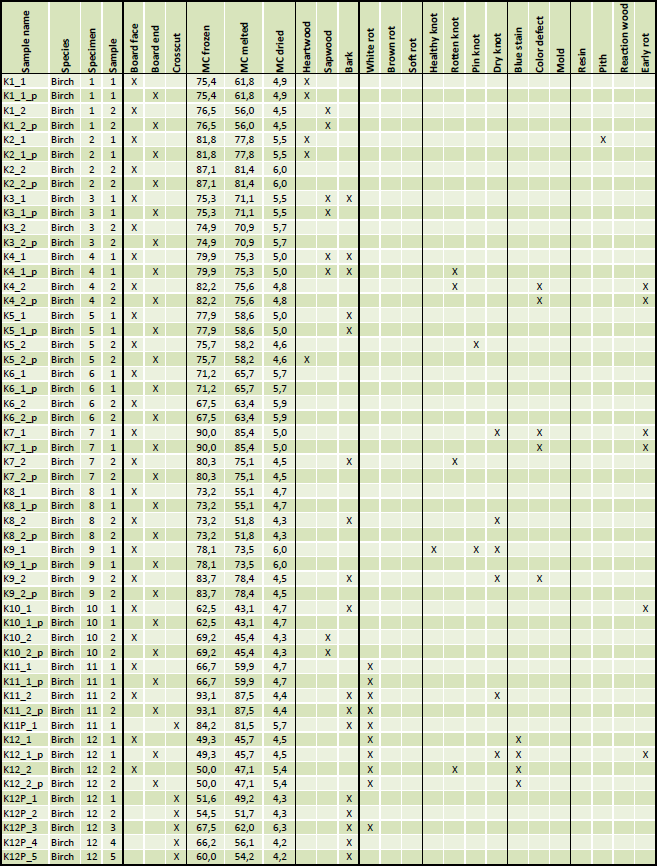
The three figures below (click to enlarge) show the filename listing for the three wood species used and the associated measured data. Figures also list the initially observed defects and types of wood present in that particular sample. Figures also lists the measurement orientations and moisture content (MC) of the wood measured. The moisture content of each sample was estimated as frozen, as melted, and as oven dried. These arrays make the data easy to access and observe the defects from the spectral image database.
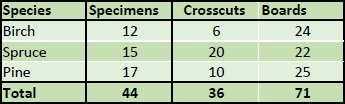
And in the array below are once more listed all measured amount of each sample type. The sum of crosscuts and boards create the total amount of samples measured. Specimens describe the amount of unique tree specimens from which the crosscuts and boards had been created.
Example visuals extracted from the database
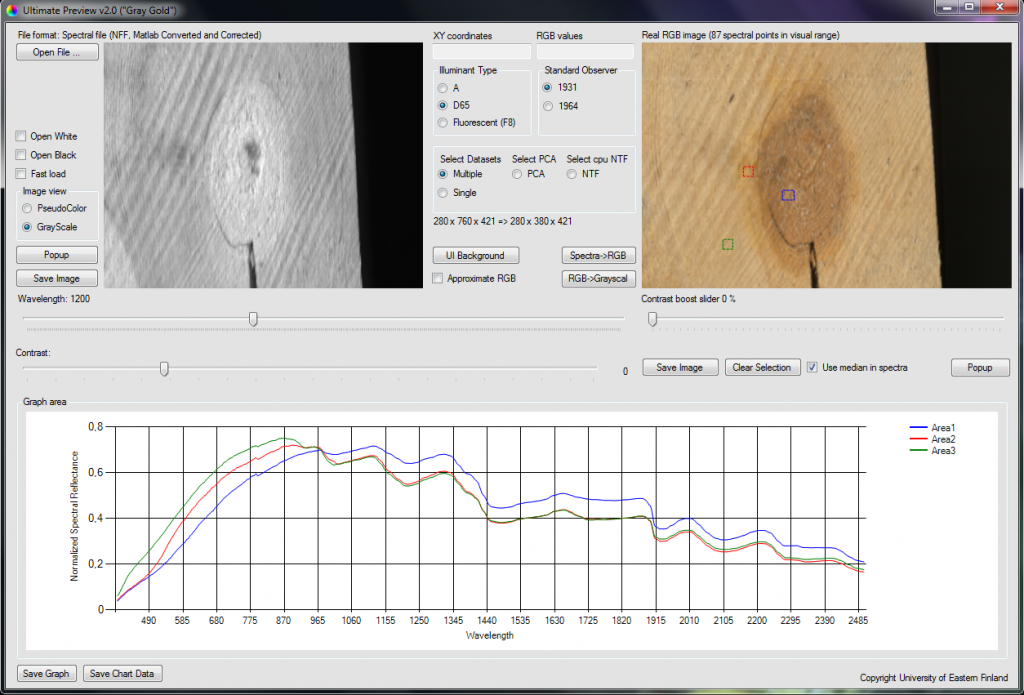
Database is saved as a custom binary data files. The database includes full report file for the file structure and Matlab programs for accessing the data. The database also includes a viewer program for quick visual evaluation of data. The viewer parses the data as a binned version to memory, which enables extremely fluent visual inspections of individual wavelength images, RGB evaluation of the image, and the point-wise spectral data. Below is shown version 2.0 of the viewer program.
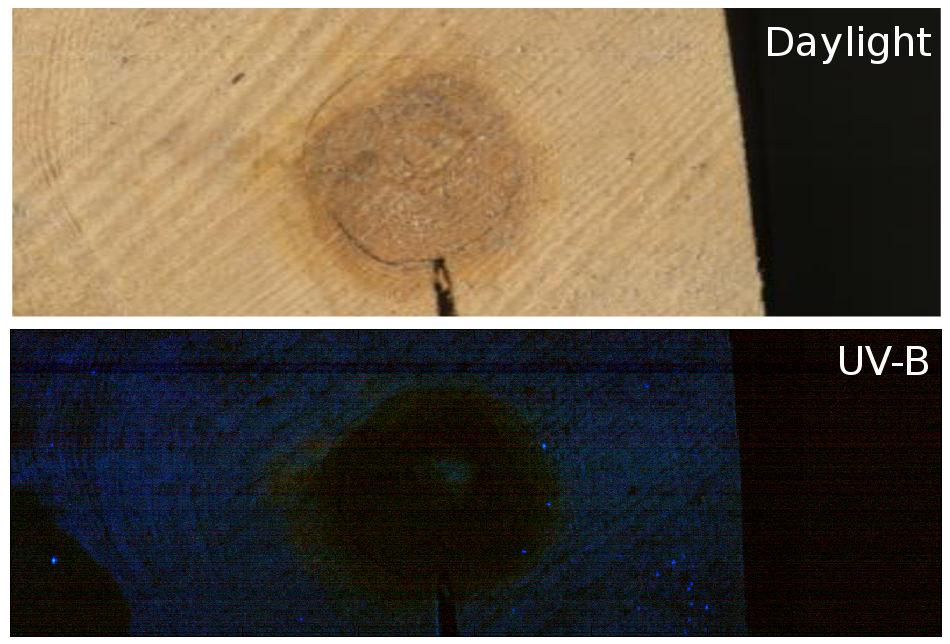
Below are calculated RGBs from the spectral image data of a pine sample. Upper inset is illuminated with halogen light and bottom inset is illuminated with UV light. The calculation is done with D65 in both RGBs. The spatial distribution of the fluorescence as well as different fluorescent sources are clearly visible.
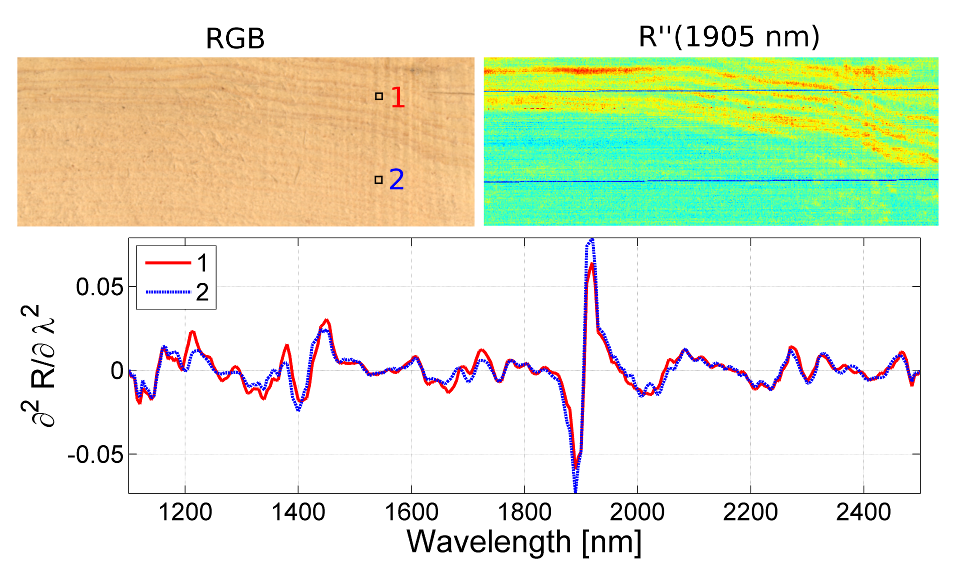
Below is example of the spectral image data usage. Two unique areas of very much similar wood types (on the RGB image at upper left inset) and the second derivate of the spatial median spectra from those areas (bottom). Also, visible (upper right inset) the false color image of the same wood sample showing the spectral second derivate image from the 1905 nm area. Depending from citation source this wavelength area has been connected to lignin, hemicellulose, and/or water. Indeed, there are interesting spatial and spectral phenomena present in the database data.
Sharing license of the database data
This database is licensed under a Creative Commons Attribution-NonCommercial-ShareAlike 4.0 International License. We also want to be clear that anybody is free to publish any papers containing results derived from this database as long as the database is cited properly.
Sharing license of the viewer program provided with the database
The data viewer PC program provided with the database “Ultimate Preview 2.0” by Niko Penttinen and University of Eastern Finland is licensed under a Creative Commons Attribution-NonCommercial-NoDerivatives 4.0 International License.